
Blogs

News
Software IT
Marketo Engage is a complete solution for B2B and opportunity management marketers who want to transform customer experiences by interacting at all stages of complex buying journeys.
By natively supporting both on-demand and account-based marketing strategies, Marketo Engage brings together the efforts of marketing and sales to orchestrate personalised experiences, optimise content and measure business impact across all channels, from acquisition to promotion.
Marketo Engage is part of Adobe Experience Cloud, a complete solution for B2B customer experience management.
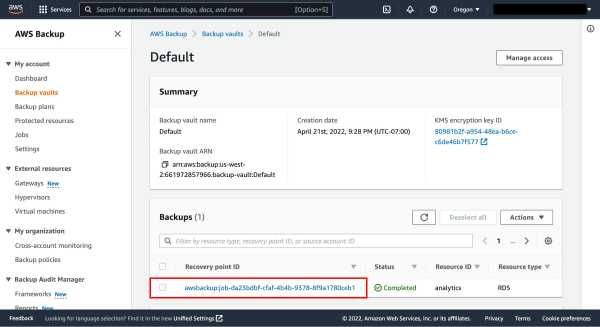
Amazon RDS (Relational Database Service) is a managed relational database service that simplifies the setup, operation, and scaling of databases in the cloud..
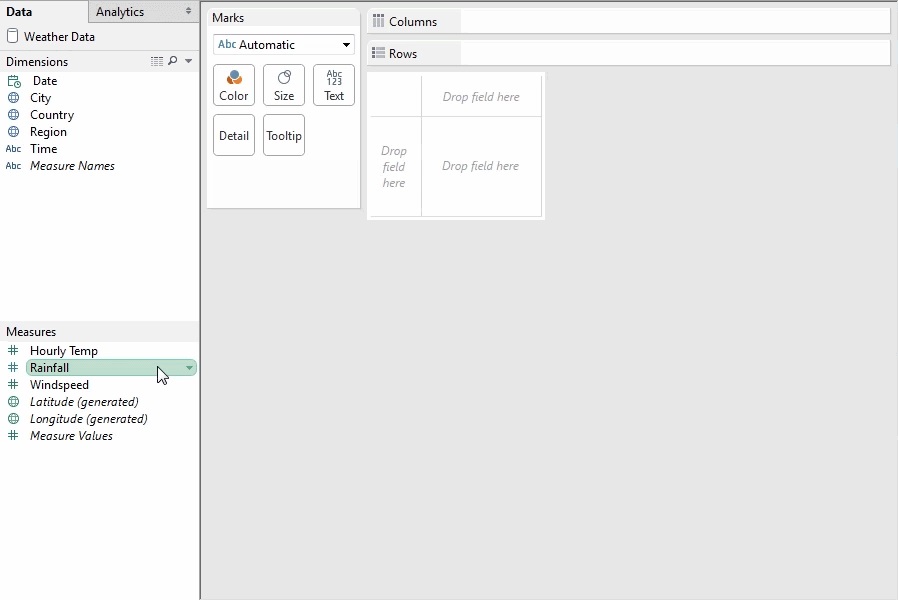
Tableau is an extremely versatile business analytics software that allows you to directly connect to multiple data sources and quickly create analytical reports and dashboards without the need to implement a metadata layer. This facilitates the direct use of the analytical tool by analysts and business users, minimizing dependence on the IT department...
